Or how to ‘kip’ your mouth shut
The latest episode from Zembla, a Dutch television documentary series, has revealed some outstanding qualities of research at WUR.
In line with the university’s ongoing support for organic food (remember all those organic vegetables during canteen times?), it took part in a study investigating how healthy going organic really was. After feeding generations of chickens either organic or conventional feed, the study set out to compare several characteristics signaling chicken health.
One of the results showed that organic chickens recovered faster from disease than non-organic chickens, however, this result was not brought out publicly under pressure from both their funding partner and a WUR professor.
It seems that the most pressing factor that determines chicken health commonly goes by the name of ‘financial interests’ and it does not really require an animal nutrition degree to understand it, but instead you can make use of this thorough and useful guide on how to follow the researchers’ footsteps.
Tip #1: Regression lines are only relative to the orientation of your screen.
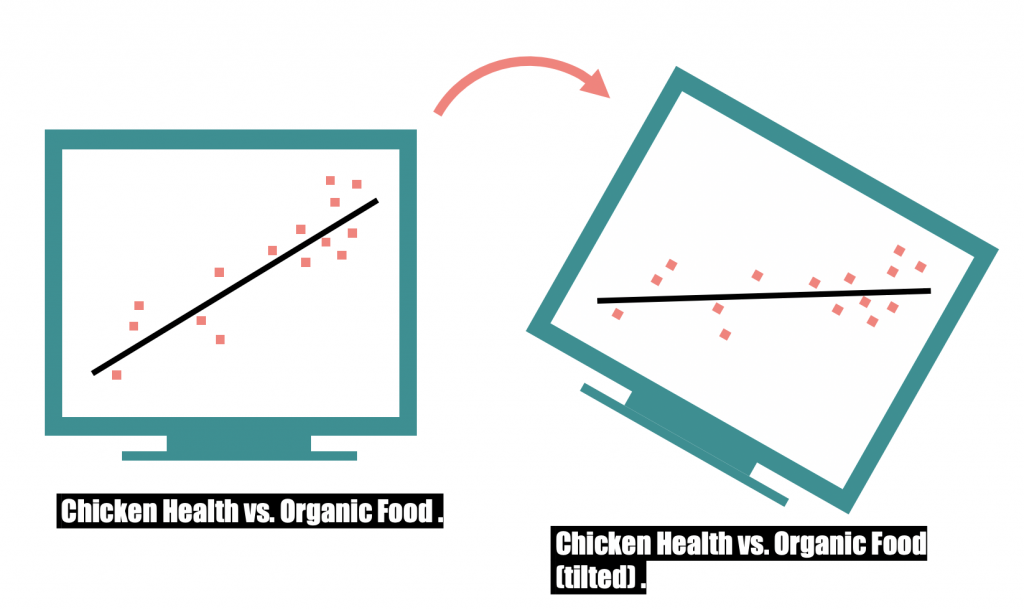
As soon as you see the slightest bit of a slope, easy—just turn your screen.
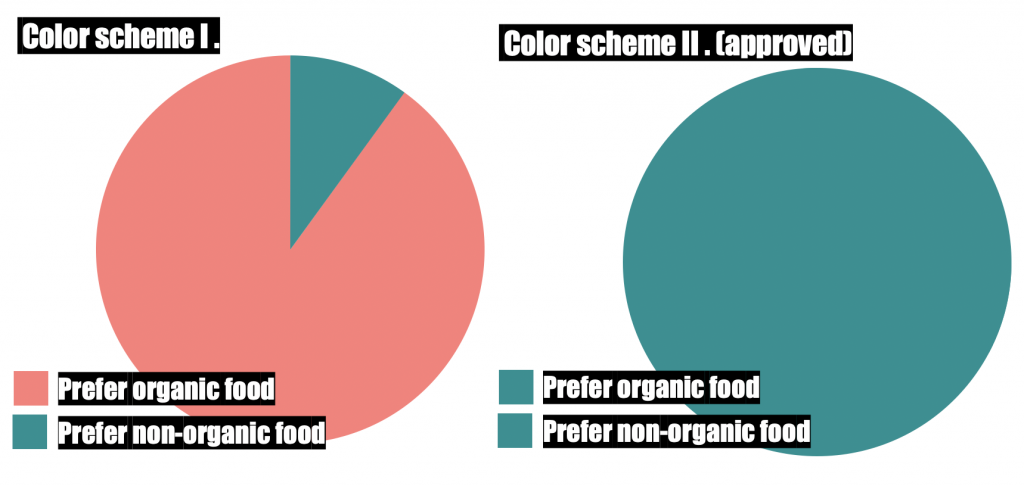
Tip #2: Use a-color scheme
When drawing a pie chart, avoid varying too much your choice of colors. In fact, avoid varying it at all.
Tip #3: Be resourceful
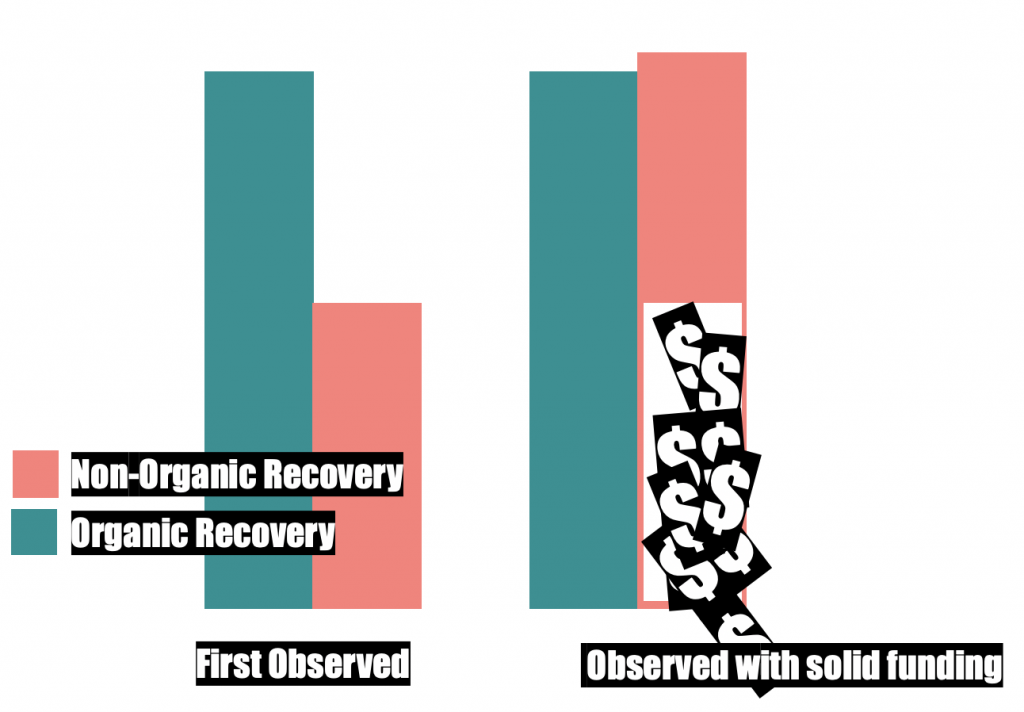
What did you think those stacks of bills were for?
Tip #4: Include some qualitative data
This is especially useful if you can interview the subjects, and if the subjects are (in)competent enough to give you the content you need.
So next time you are wondering how not to displease your funders, don’t worry—with these, and other tips from your professors, you can contribute to keeping the status quo untouched.